

Sunday, February 1. 2015
Command tool to display JMX attributes
This week a colleague asked to our engineers' mailing list how the jconsole tool retrieved the attributes that are shown in this graphical application. Her customer wanted to use the command line to obtain some data from one application instead of the graphical environment that jconsole shows. As you know the jconsole is a JMX (Java Management Extensions) client application that connects to a JMX server in order to display and plot the information provided by the different MBeans. A Managed Bean (usually just MBean) represents a resource running in the Java virtual machine which can be used to collect statistics, to get or set configuration properties and to notify events. It is also important that any Java application can be a JMX server just defining the com.sun.management.jmxremote property, in order to have its own monitoring it will need to register its own MBeans (if no custom beans are added only the default Java monitoring will be possible).
I knew that the technology provides also an API, so I supposed that the jconsole tool uses it to display all the data. Finally I decided to implement a little Java class that uses the API to obtain some sample data from any Java application with JMX activated. I sent to my colleague that little and shoddy main class file (just as an example of how JMX works). Today's entry is going to improve that class and presents a simple java command to display the attribute values of any MBean inside a JMX server.
Tomcat is going to be the JMX server. For that reason it is needed to configure the Servlet container to display JMX information. JMX monitoring was configured to request username and password in a plain (not SSL / TLS) connection adding the following properties to the startup catalina.sh file.
CATALINA_OPTS="${CATALINA_OPTS} -Dcom.sun.management.jmxremote -Dcom.sun.management.jmxremote.port=9010 -Dcom.sun.management.jmxremote.authenticate=true -Dcom.sun.management.jmxremote.password.file=../conf/jmxremote.password -Dcom.sun.management.jmxremote.access.file=../conf/jmxremote.access -Dcom.sun.management.jmxremote.ssl=false"
The two files specified contains the users and passwords (jmxremote.password) and the permissions for each user (jmxremote.access).
$ cat jmxremote.password
monitorRole tomcat
controlRole tomcat
$ cat jmxremote.access
monitorRole readonly
controlRole readwrite
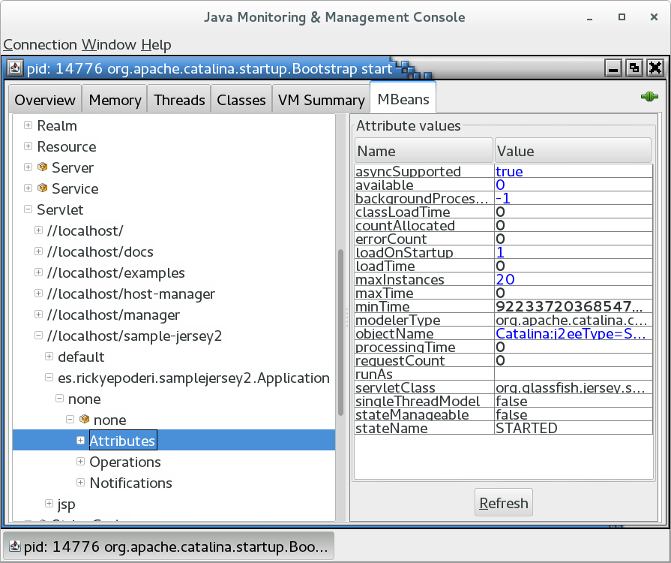
With those properties you can already execute the jconsole command and connect to the tomcat process in order to check if JMX is working. The JMX server displays a Catalina domain with a lot of internal tomcat information. For example in the MBeans tab, the object Catalina → Servlet → //localhost/sample-jersey2 → es.rickyepoderi.samplejersey2.Application → none → none → Attributes shows statistical information of the jersey servlet of the previous entry (which is still deployed in the tomcat server).
And now let's present the java program. I developed it mainly following the JMX tutorial. The JmxExplorer utility is a very simple program to read the attributes exposed for the different MBeans. But in order to find the correct bean some more options are available. First you just have to compile the java file (JDK 7 or newer is needed) and then the usage help is shown.
$ javac JmxExplorer.java
$ java JmxExplorer
Exception in thread "main" java.lang.IllegalArgumentException:

ERROR: No command specified

USAGE: java JmxExplorer options command

  options:
    -U|--url: JMX url to connect to (default: service:jmx:rmi:///jndi/rmi://:9010/jmxrmi)
    -u|--username: username for the JMX connection (deafult: null)
                   Use "-" to request the password interactively
    -p|--password: password for the JMX connection (deafult: null)

  command:
    local: list the local JMVs in the machine (pid, JMX url and command line)
           "tools.jar" is needed, please add ${JAVA_HOME}/lib/tools.jar to the classpath
    domains: list the JMX domains that exist in the server
    mbeans [<pattern>]: list the mbeans in the server (if pattern is specified
                        only the ones that matches it)
    info <mbean>: list the attribute names of the mbean specified
    attrs <mbean> [<attr>...]: list the attribute values of the mbean specified (if
                               no attrs are specified all attributes are returned)

	at JmxExplorer.usage(JmxExplorer.java:149)
	at JmxExplorer.main(JmxExplorer.java:423)
The tool can show the local JMX url for the VMs that are running locally (it uses the Attach API for doing that). The problem is that this API is inside the tools.jar. So in order to execute that command the jar should be included in the execution classpath (the tool calls this API using reflection, so it is not needed for executing the rest of the commands or compilation).
$ java -cp /usr/lib/jvm/default-java/lib/tools.jar:. JmxExplorer local
4022 - JmxExplorer local
2388 - sun.tools.jconsole.JConsole
2712 - org.netbeans.Main --cachedir /home/ricky/.cache/netbeans/8.0.2 --userdir /home/ricky/.netbeans/8.0.2 --branding nb
2364 service:jmx:rmi://127.0.0.1/stub/rO0AB...Hg= org.apache.catalina.startup.Bootstrap start
In my machine were four JVMs executed but only tomcat is exposing a local JMX connection URL. Nevertheless all the following commands will use the typical host and port URL instead of the local one. The tool can also be used to display the JMX domains included in the server.
$ java JmxExplorer -u monitorRole -p tomcat domains
JMImplementation
Users
com.sun.management
Catalina
java.nio
java.lang
java.util.logging
Using the mbeans argument the beans exposed by the server are displayed. The argument can have a pattern (the format is described in the JMX API but, if this pattern is not passed, all the MBeans are listed). This execution lists all the mbeans in the java.nio domain.
$ java JmxExplorer -u monitorRole -p tomcat mbeans "java.nio:*"
java.nio:type=BufferPool,name=direct
java.nio:type=BufferPool,name=mapped
And the following one lists all the servlet MBeans exposed in the jersey application presented in the previous entry (the application name was sample-jersey2).
$ java JmxExplorer -u monitorRole -p tomcat mbeans "Catalina:j2eeType=Servlet,WebModule=//localhost/sample-jersey2,*"
Catalina:j2eeType=Servlet,WebModule=//localhost/sample-jersey2,name=jsp,J2EEApplication=none,J2EEServer=none
Catalina:j2eeType=Servlet,WebModule=//localhost/sample-jersey2,name=es.rickyepoderi.samplejersey2.Application,J2EEApplication=none,J2EEServer=none
Catalina:j2eeType=Servlet,WebModule=//localhost/sample-jersey2,name=default,J2EEApplication=none,J2EEServer=none
The command also displays the attributes that any MBean has, for example the jersey servlet displayed by the previous execution has the following attributes.
$ java JmxExplorer -u monitorRole -p tomcat info Catalina:j2eeType=Servlet,WebModule=//localhost/sample-jersey2,name=es.rickyepoderi.samplejersey2.Application,J2EEApplication=none,J2EEServer=none
errorCount(int): Error count
singleThreadModel(boolean): Does this servlet implement the SingleThreadModel interface?
classLoadTime(int): Time taken to load the Servlet class
available(long): The date and time at which this servlet will become available (in milliseconds since the epoch), or zero if the servlet is available. If this value equals Long.MAX_VALUE, the unavailability of this servlet is considered permanent.
runAs(java.lang.String): The run-as identity for this servlet.
backgroundProcessorDelay(int): The processor delay for this component.
modelerType(java.lang.String): Type of the modeled resource. Can be set only once
stateManageable(boolean): State management support for this managed object
countAllocated(int): The count of allocations that are currently active (even if they  are for the same instance, as will be true on a non-STM servlet).
minTime(long): Minimum processing time of a request
maxTime(long): Maximum processing time of a request
loadTime(long): Time taken to load and initialise the Servlet
stateName(java.lang.String): The name of the LifecycleState that this component is currently in
objectName(java.lang.String): Name of the object
servletClass(java.lang.String): The run-as identity for this servlet.
asyncSupported(boolean): Async support
loadOnStartup(int): The load-on-startup order value (negative value means load on first call) for this servlet.
processingTime(long): Total execution time of the servlet's service method
requestCount(int): Number of requests processed by this wrapper
maxInstances(int): Maximum number of STM instances.
And finally the command can be used to retrieve the current value of any MBean attribute (the attrs option retrieves the values of all the bean attributes or only the ones specified in the command line).
$ java JmxExplorer -u monitorRole -p tomcat attrs Catalina:j2eeType=Servlet,WebModule=//localhost/sample-jersey2,name=es.rickyepoderi.samplejersey2.Application,J2EEApplication=none,J2EEServer=none minTime maxTime requestCount processingTime
processingTime: 147
minTime: 2
requestCount: 6
maxTime: 115
So it is quite simple, the command is intended to be used to retrieve the values of the MBean attributes of a JMX server, but some more options are available to look for what attributes and what MBean are wanted. The JMX API can be more complicated (it can instantiate a MBean object for example, but for this task you need the class provided by the JMX server for that specific MBean), so I decided to operate exactly as jconsole does. The command only needs a JavaSE 7 JDK to run. I know it is a quite simple entry, but I have spent some time to develop the Java class and I do not want to lose it. The blog is the best place to keep it save and available for everyone.
Cheerio!
Comments